Chapter 4: Ad Analytics You Should Know
Now that you are well versed in developing and creating an ad for your business, over time, you will want to know how your ads are performing, what to be looking out for, and how to actually monitor your ads using ad analytics.

Now that you are well versed in developing and creating an ad for your business, over time, you will want to know how your ads are performing, what to be looking out for, and how to actually monitor your ads using ad analytics.
Ad analytics are all the statistics, data, and indicators that you need to understand the habits of those who are coming across your ads and posts. This helps you develop an idea on what you could be doing better.
Studying analytics can be a bit tedious for beginners. With so many things to keep track of, it can be overwhelming to make sense of it all.
For this chapter, we will be focusing on the 7 main metrics to keep an eye on that are indicators on how well your ad is doing. This will keep things simple and straightforward, allowing you to dive into performance without getting caught up in the minutia.
Impressions
Impressions are the number of times your ad has been seen. Impressions are a high-level metric that allows you to see the general brand awareness that your ad campaigns are creating.
High impressions mean that users are either coming across your ads multiple times during different browsing sessions, it’s being put in front of more users, or a combination of the two.
Impressions are crucial in gauging if you are getting the right number of eyeballs on your ads. The more people are coming across your ad the better.
This means that there is a greater chance for someone to take the next step and engage or click.

Scrolled by this Ad on this blog? This would count as an Impression on Facebook, regardless of whether you click or not.
Clicks
A click is an actual action on a Facebook Ad. Simply seeing an ad, leads to an impression, but having a user actually go to your URL or landing page counts as a click. The goal for all businesses is to generate clicks, and having a large number of impressions increases the chance of someone clicking on your ad, leading to a greater chance of a sale.
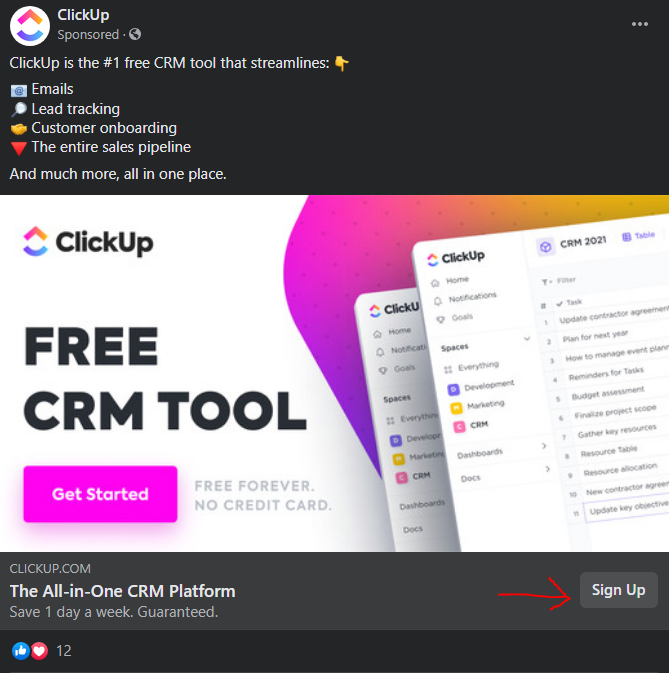
A click would count on this ad if you clicked on the “Sign Up” button, which would lead you to ClickUp’s website or landing page.
CPM

CPM or cost per 1000 impressions is another way to pin the cost-efficiency of your Facebook advertising and is calculated by the total amount spent on an advertising campaign divided by the number of impressions and multiplied by 1000.
Cost Per Result
Cost per result is how much it is costing you to achieve the “results” of your campaigns. The total dollar amount spent during a specific time period divided by the number of results is how you calculate cost per result.
Note that your “result” is your campaign’s goal, whether that’s engagement, traffic, reach, etc.
Cost per result is an indicator of how efficient you are with your budget and encompasses everything from how compelling your ad is, to how accurately you are getting in front of your target audience. Better ads will have lower cost per results.
If you are running multiple campaigns, comparing your ads with “cost per result” is a good way to measure which campaign is making a better use of your money.
Frequency
Ad frequency takes the impressions metric to the next level. Ad frequency will tell you how many times on average your ad has been viewed by an individual.
On average it takes a user 7 times of seeing a brand for them to be able to recall that brand, so increasing your ad frequency to 7 or more per person is a goal most businesses and companies strive for.
This is why ad agencies typically have multiple variations of ads with different messaging and creatives, even if they are targeting the same audience.
It keeps things fresh and interesting while also helping the user actually retail the brand and what they are about.
Relevance Score
Relevance score is based on the feedback expected on your ads from your target audience. The relevance score increases when there is more positive feedback relative to negative feedback and is calculated on a scale from 1-10.
A high relevance score means that the cost of advertising and reaching your target audience will likely be less, saving you money in the long haul.
Marketers love to A/B test their ads and their creatives to see where they rank on the relevance score, helping them put that winning ad into the limelight for the world to see.
Return On Ad Spend
Return on ad spend is typically the metric which causes business owners’ eyes to widen with excitement. It answers the question of how much money has been made above and beyond the cost of advertising.

ROAS measures revenue generated per dollar spent in an advertising campaign, and can be expressed as a ratio. The bigger the ratio, the bigger the return on your investment. Return on ad spend puts a tangible number behind how effective your marketing has been so far.
ROAS helps to put into perspective your Ad Spend relative to how much a conversion is going to generate us, so that we can dial up or dial back our spend accordingly.
Although there are a multitude of different analytics and statistics to track, these are the most impactful and should be focused on above many of the rest.
These will all give you a comprehensive idea on whether your ads are performing, if you need to switch up the images or the graphics, change the copy to be more bold, or if the angle of your offering needs a pivot.
Lots to learn? Simplify your social media advertising with AdPuzl, a powerful ad creation tool built for beginners.